
The Climate Risk and Road Safety Risk Assessment project for Bhubaneswar and Surat aims to integrate advanced GeoAI-driven climate analytics with iRAP-based road safety diagnostics, enabling city authorities to strengthen resilience, reduce vulnerabilities, and plan safer and climate-smart transportation systems.
Both cities face unique climate and mobility challenges:
Bhubaneswar, located in Odisha’s cyclone corridor, regularly experiences extreme heatwaves, intense rainfall, and deteriorating air quality.
Surat, one of India’s fastest-growing metropolises, faces recurrent urban flooding, severe heat stress, and high pollution linked to rapid industrialisation and mobility patterns.
The dual assessment under the GIZ SUMACA programme seeks to provide a unified analytical framework that connects climate hazards, road infrastructure vulnerabilities, and mobility safety outcomes—enabling better decision-making across infrastructure planning, public safety, and environmental resilience.
GIZ India
2024-2025
Bhubaneswar & Surat
The objective of this initiative is to evaluate the climate risk profile of both cities, assess road infrastructure vulnerabilities through GeoAI and iRAP methodologies, propose nature-based solutions, and develop an integrated geospatial dashboard under the Bhubaneswar One platform.
The study will bridge climate science with transport engineering and urban planning, enabling authorities to incorporate climate risk overlays, road safety star ratings, and resilience insights into ongoing and future development works.
The project leverages cutting-edge GeoAI and remote sensing analytics to map heat stress, urban flooding, air pollution, and wind hazards across Bhubaneswar and Surat. These insights create a scientific foundation for understanding evolving climate risks at city and corridor levels.
A full iRAP assessment has been undertaken for all major roads, generating Star Ratings, identifying crash risk factors, and preparing a Safer Roads Investment Plan. This ensures a structured, evidence-based pathway for improving mobility safety.
High-resolution climate and safety data were integrated to assess vulnerability levels for road networks, public buildings, and high-footfall amenities. This combined analysis highlights priority locations requiring resilience upgrades and targeted interventions.
The project identifies scalable NBS—at network, zone, and spot levels—to mitigate heat, flooding, and pollution risks while enhancing pedestrian and road safety. Recommendations emphasize native species, permeable landscapes, and climate-adaptive design.
A powerful dashboard has been developed to visualize climate risks, iRAP Star Ratings, and infrastructure vulnerabilities. Integrated into the Bhubaneswar One system, it serves as a centralized decision-support platform for planners and authorities.
Field investigations, validation exercises, and consultations with key agencies enrich the recommendations with on-ground insights. Training sessions strengthen institutional capacity to interpret climate and safety data and apply them in planning and design.
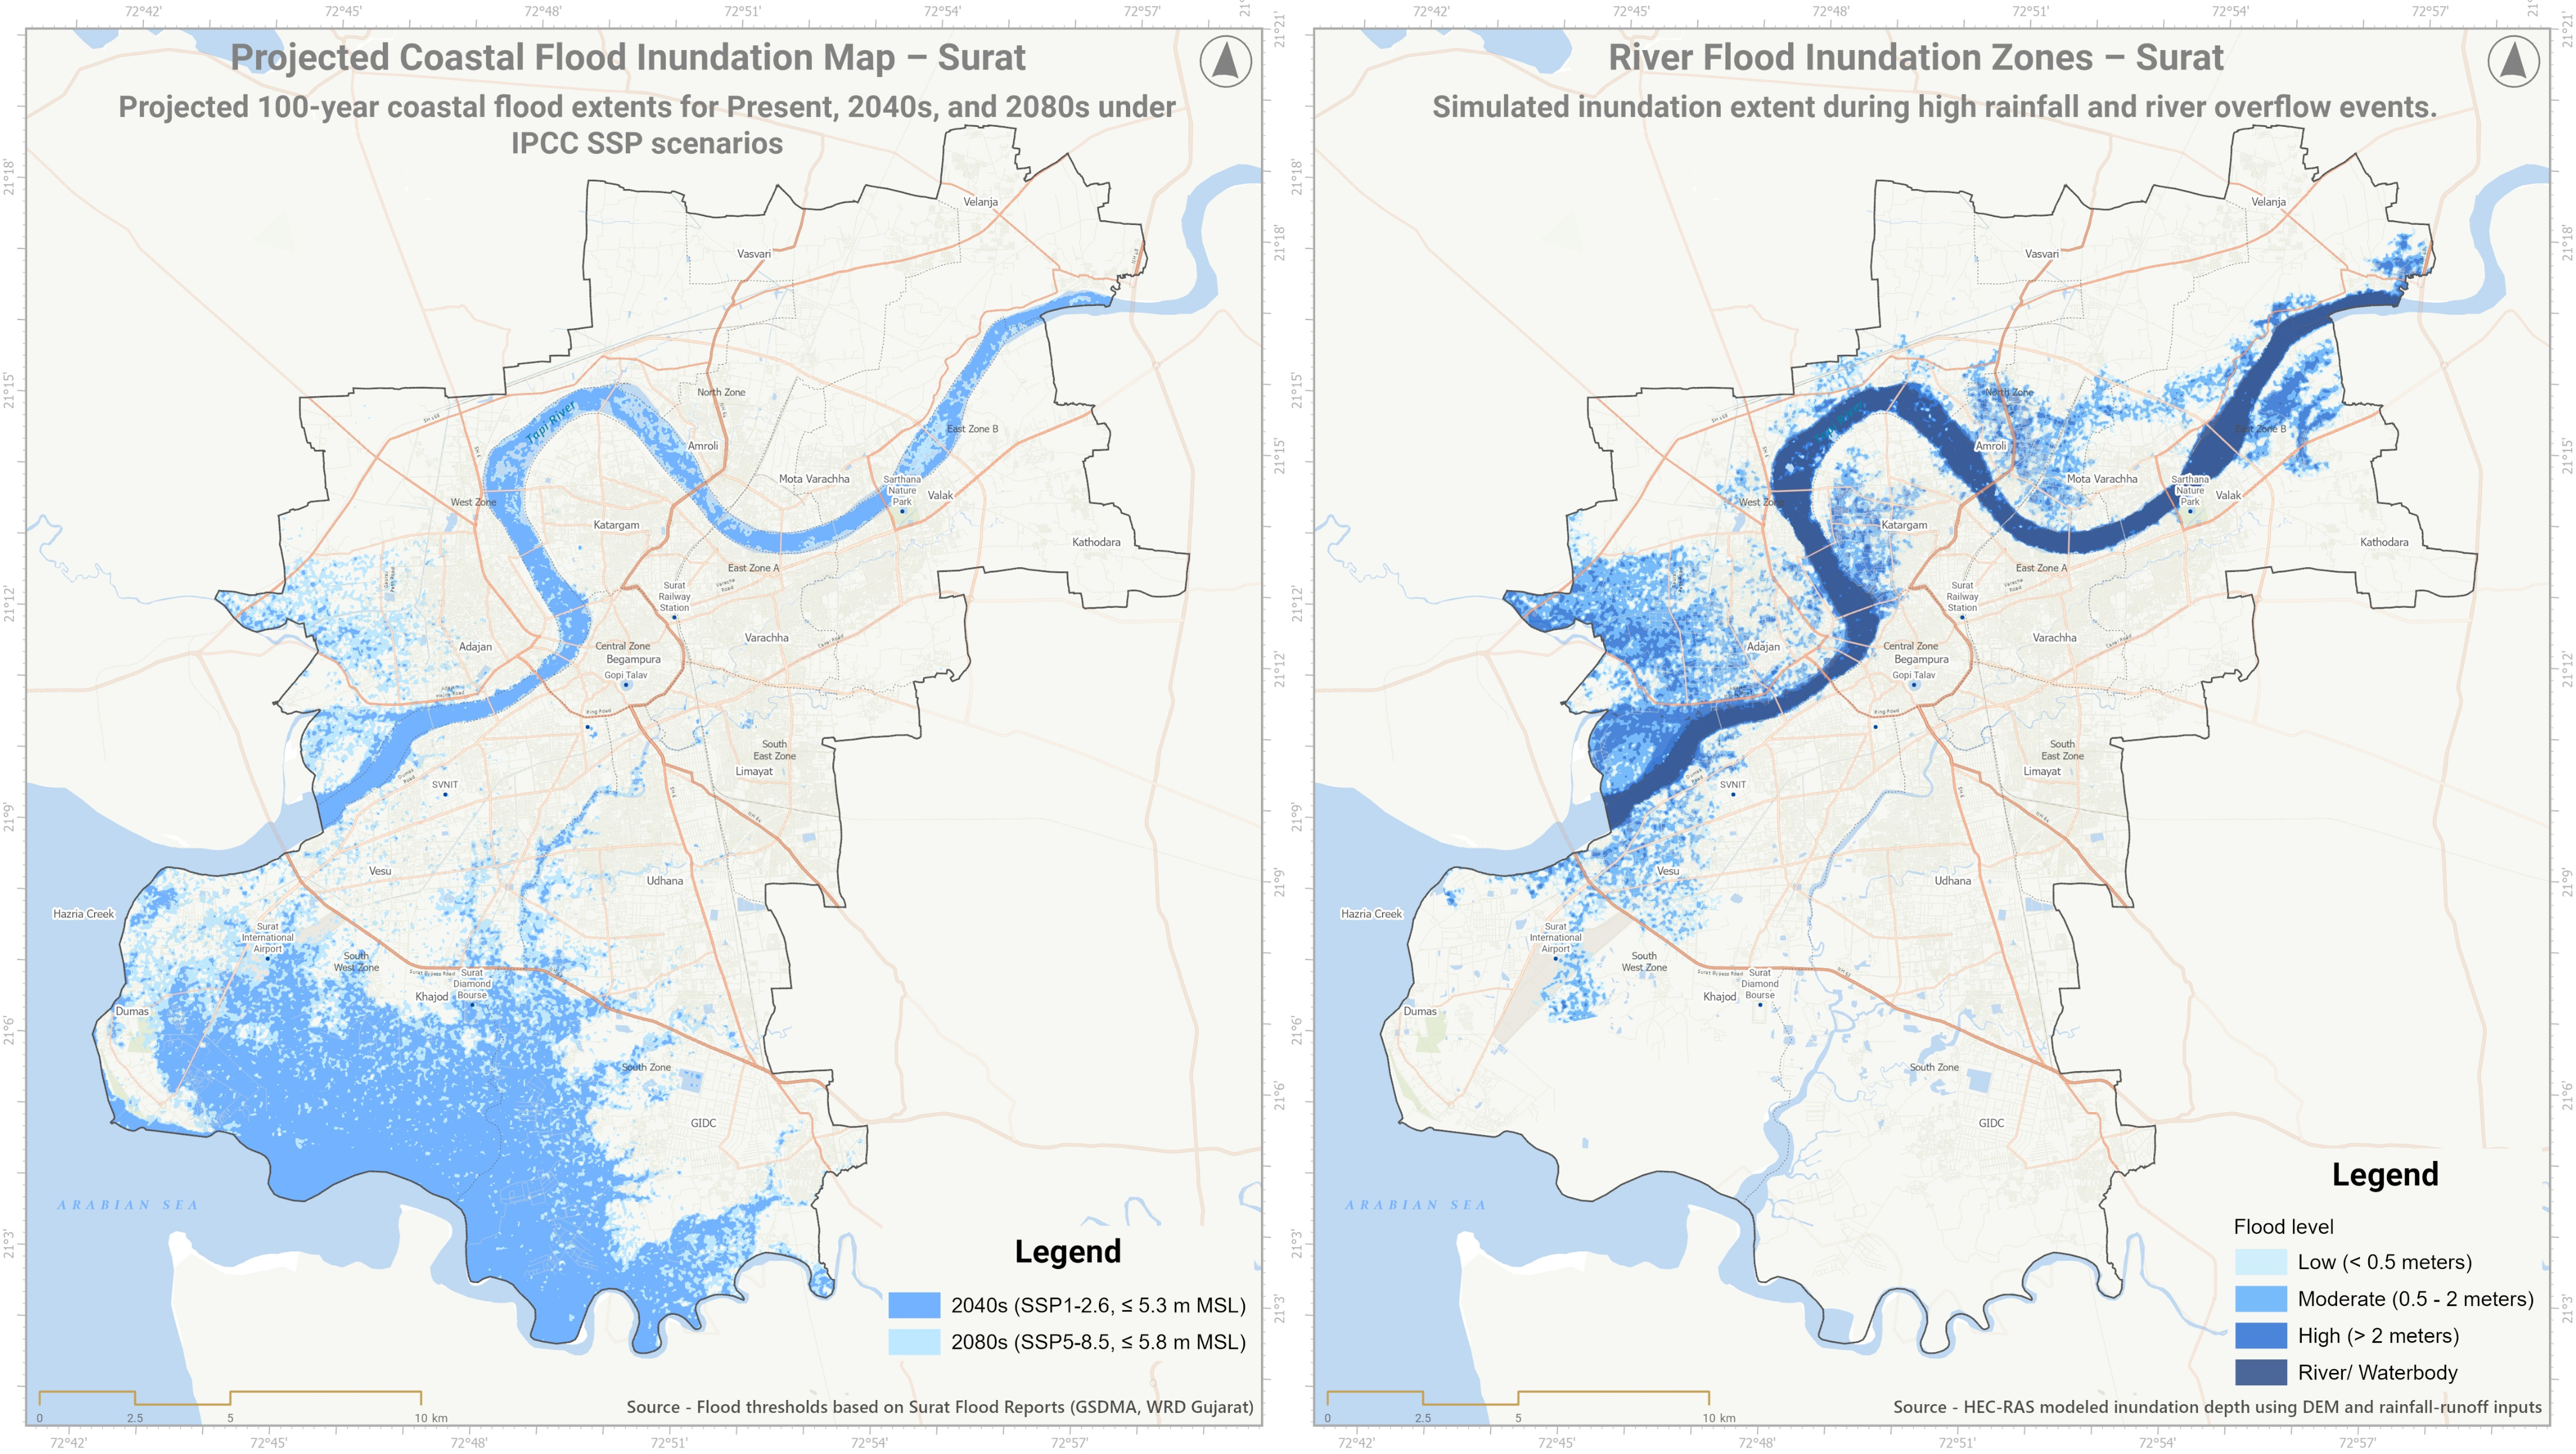
The flood risk illustrations for Surat highlight how both riverine and coastal processes shape the city’s vulnerability. The river flood map simulates inundation depths during high-rainfall and river overflow events, showing how low-lying areas along the Tapi and its distributaries experience varying flood intensities. In contrast, the coastal inundation map projects 100-year flood extents under IPCC SSP climate scenarios, revealing how sea-level rise amplifies flood exposure across southern and western parts of the city. Together, these maps provide a comprehensive understanding of Surat’s multi-dimensional flood risks, supporting planners in identifying priority zones and designing long-term resilience strategies.